To plot magnitude and phase spectrum in Matlab, use the built-in function “fft”. Here’s a concise tutorial on how to do it: To analyze signals and systems in communication engineering, the magnitude and phase spectrum is an essential tool.
It helps in studying the behavior of the signal in the frequency domain. Matlab offers a built-in function “fft” (Fast Fourier Transform) that enables users to calculate magnitude and phase spectra of a signal. With just a few lines of code, you can plot these spectral characteristics and interpret your data.
Whether you’re a student or an engineer, learning how to plot magnitude and phase spectrum in Matlab will help you in your communication analysis tasks. In this tutorial, we’ll walk you through the process, step-by-step.
Plotting In Matlab
Learn how to plot magnitude and phase spectrum in Matlab using simple steps. With its user-friendly interface and advanced features, Matlab is the perfect tool for plotting and visualizing data in various forms.
Matlab is a powerful tool for plotting different types of graphs. It provides various basic plot commands for creating different types of graphs, including line, scatter, bar, and pie charts. The process of plotting involves defining the data and then customizing the plot accordingly. With basic plot commands, the user can adjust the labels, titles, and colors of the graph. Matlab also provides various built-in functions for advanced plotting, including 3D graphs, contour plots, and image plots.
Overview of plotting in Matlab
| Step 1 | Define the data to be plotted |
| Step 2 | Choose a basic plot command (line, scatter, bar, pie) |
| Step 3 | Customize the plot with labels, titles, and colors |
| Step 4 | Save the plot as an image file |
Plotting in Matlab is a useful skill for visualizing data in a clear and concise way. By following simple steps and using basic plot commands, one can create a variety of graphs that showcase data in an informative manner.

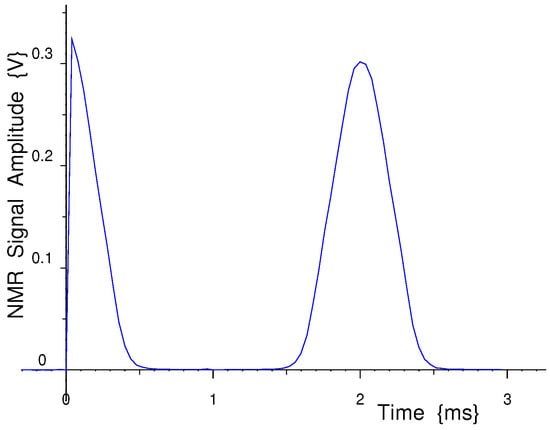
Credit: www.mdpi.com
Magnitude Spectrum
Magnitude spectrum is the magnitude of the Fourier coefficients of a signal. It is useful in identifying the strength of each frequency component in the signal. In Matlab, magnitude spectrum can be computed using the fft function. Once the Fourier coefficients are obtained, the magnitudes are calculated using the abs function. The magnitudes are then plotted against frequency to visualize the spectrum. Magnitude spectrum is commonly used in digital signal processing for applications such as noise reduction and filtering.
| Code | Description |
|---|---|
spectrum = abs(fft(signal)); |
Computes the Fourier coefficients and takes the absolute value to obtain the magnitudes. |
frequencies = linspace(0, fs/2, length(signal)/2+1); |
Creates a linearly spaced vector of frequencies up to the Nyquist limit. |
plot(frequencies, spectrum(1:length(frequencies))); |
Plots the magnitudes against the corresponding frequencies. |
Phase Spectrum
To plot magnitude and phase spectrum in Matlab, one must understand the concept of phase spectrum. It is the representation of the phase shift between the input and output signals in the frequency domain. With the right knowledge and tools, users can easily plot both magnitude and phase spectrum in Matlab.
| Phase Spectrum |
|---|
| When plotting the phase spectrum in Matlab, it is important to understand what it represents. The phase spectrum is a plot of the phase angle of the Fourier transform of a signal, which represents the timing of the waves that make up the signal. |
| To calculate and plot the phase spectrum in Matlab, you can use the built-in function “angle” to extract the phase angle of the signal’s Fourier transform. You can then plot this angle against the frequency using the “plot” function. It is important to note that the phase spectrum is measured in radians. |
| The phase spectrum can provide valuable insights into the structure of a signal. For example, it can help identify the delays between different frequency components of the signal or show how the phase of the signal changes over time. Understanding how to plot and interpret the phase spectrum is an important tool for signal processing and analysis in Matlab. |
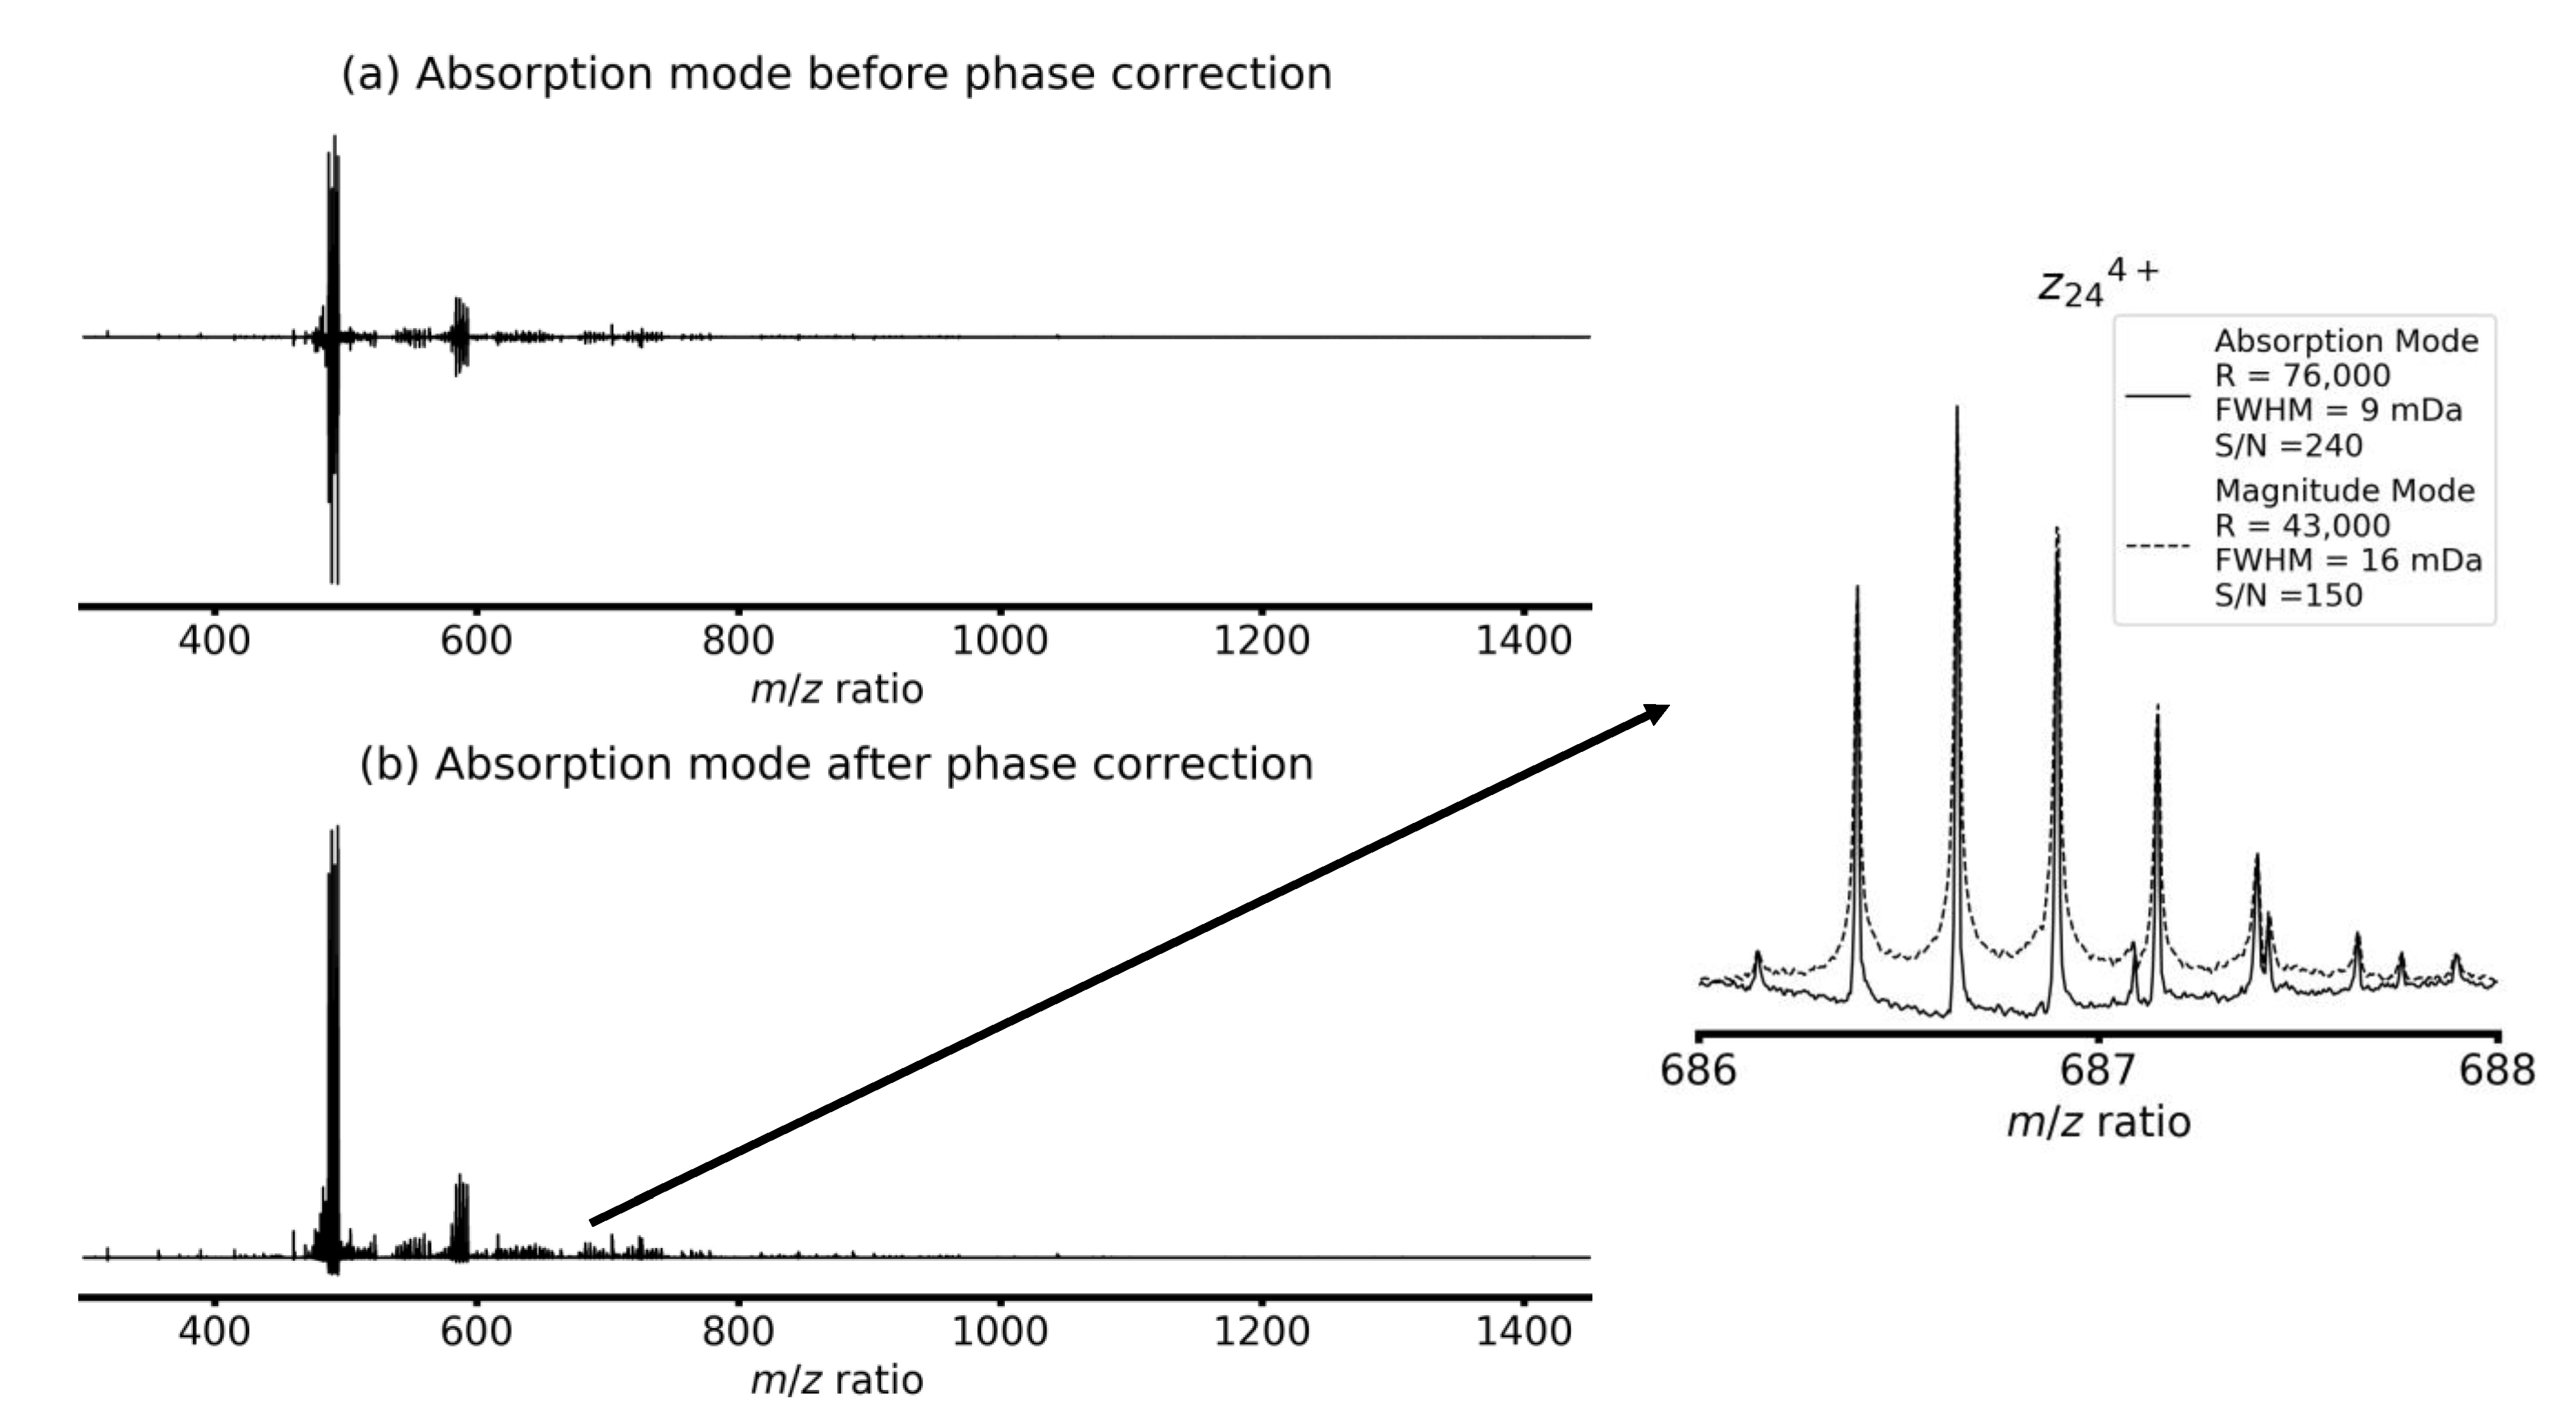
Credit: www.mdpi.com
Tips And Tricks
Learn how to plot magnitude and phase spectrum in Matlab with these simple tips and tricks. With easy to follow steps and clear explanations, this guide is perfect for anyone looking to improve their MATLAB skills.
To plot magnitude and phase spectrum in Matlab, there are a few Tips and Tricks we can use to make the process easier. Firstly, customizing plots is essential. You can change labels, colors, and fonts to make the plots more readable and attractive. Secondly, dealing with noisy data can be a challenge. One way to overcome this is to apply filters to the data. Thirdly, when using the ‘fft’ function, it is crucial to remember that the output represents a two-sided spectrum. Lastly, by using the ‘unwrap’ function, you can eliminate jumps in phase that are caused by data wrapping around 360 degrees. These Tips and Tricks can help you create accurate and clear plots in Matlab with minimal effort.
Credit: www.mdpi.com
Conclusion
After going through this guide, you now have a solid understanding of how to plot magnitude and phase spectrum in Matlab. The steps are quite simple and only require a little bit of practice to master. Remember to analyze your data before plotting, use the appropriate libraries, and customize your graphs to make them easy to read and interpret.
This skill will come in handy as you work with complex signals and systems, and will allow you to generate insightful visual representations of your data.